Earlier this week, the New York City Police Department launched the crime map mandated by Local Law 39 of 2013, which City Council passed in April. (See Reinvent Albany’s testimony.) It’s good that City Council required the police to produce more information for the public. The public is intensely interested in information about crime and the security of their families. However, as an exercise in open government, the crime map is severely lacking.
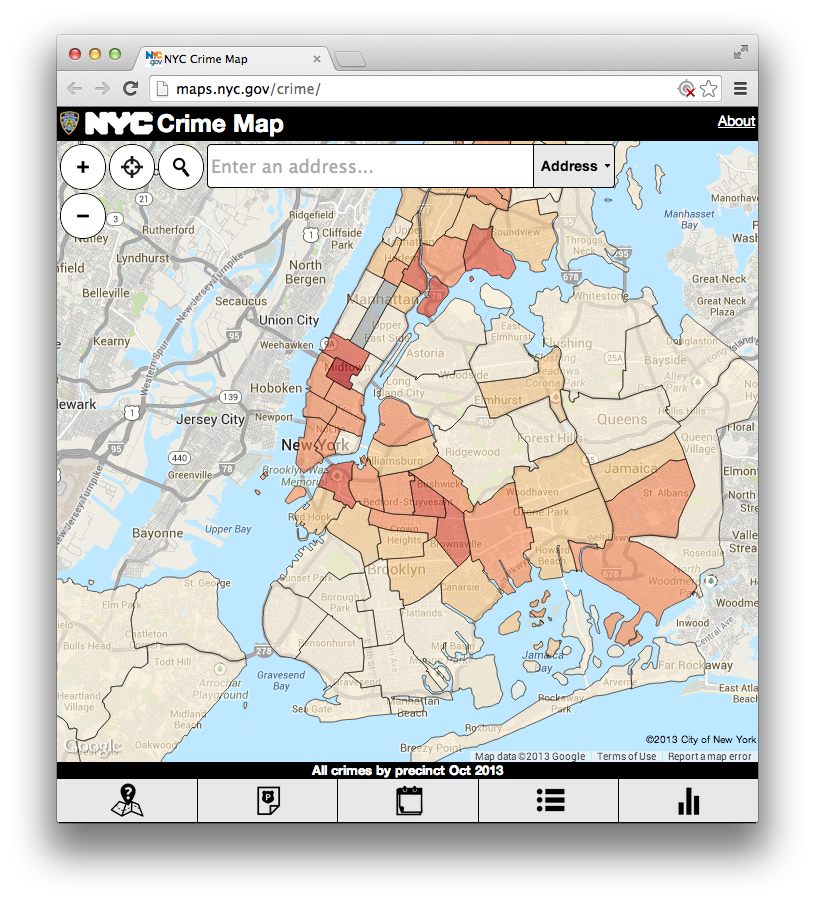
Unfortunately, Local Law 39 did not require the NYPD or DOITT to publish the data underneath the crime map. As a result, newspapers and civic hackers cannot map the data in more useful and interesting ways, as they have in places like Chicago or Los Angeles. Additionally, DOITT’s map is not particularly well executed compared to Seattles, the Chicago Tribune map or the LA Times Map. The map would have turned heads in 2000 or maybe 2005, but is not particularly impressive in 2013.
Maps are powerful tools for displaying complex data. But there is an art and science to making maps, and DOITT’s crime map is not particularly impressive compared to its peers. Take a look at the crime map the Chicago Tribune created using Chicago’s open data portal:

The Chicago crime map features far more information, displayed in far more detail, in a much more user-friendly fashion than the NYC Crime Map. The Chicago crime map, again, was built by a newspaper; the data underlying this map is published by the city (here) and put to use by interested parties, not the city. That’s not to say Chicago, or New York, or other cities are incapable of creating powerful mapping platforms. For example, the city of Seattle’s My Neighborhood Map uses intuitive icons to show all types of 911 requests, and a separate map for crimes which provides details when the cursor is hovered over an icon. Each icon also links to a complete police report. All in all, Seattle’s approach is more informative, visually intuitive and comprehensive.
In 2009, by repeatedly using New York State’s Freedom of Information Law to obtain police reports, the New York Times created a map of all homicides from 2003 onwards (updated through 2011). A lot of time and energy went into procuring the data before one line of code for that map was written. If the NYPD were to truly open their data, the Times and public safety advocates could spend less time compiling records and more time creating resources.