New Analysis: LIRR Got By Far the Most MTA Capital Investment Per Rider in Last 25 Years

A new analysis by the NYU Marron Institute of Urban Management and Reinvent Albany of the last 25 years of MTA Capital Spending makes a strong case for why suburban elected officials should support congestion pricing and investment in the 2025-2029 capital plan. Analysts found that in the five capital plans from 2000 through 2024, the MTA has spent or will spend $194 billion in constant 2024 dollars. As expected, they also found that capital spending is far higher per commuter rail rider than NYC Transit subway and/or bus rider.
Key Findings
- LIRR has received by far the most capital funds per rider over the last 25 years.
- LIRR spending is high due to mega-projects Grand Central Madison and Main Line Expansion.
- Metro-North capital spending/rider is now outpacing LIRR because of Penn Station Access.

MTA Facts
The MTA network includes 1,038 rail route miles, 5,805 buses, 9,077 rail cars, and 742 rail stations. From 2000 to 2024 ridership grew from 2.2 billion in 2000 to a high of 2.7 billion in 2014 before falling to 1.7 billion in 2024 because of the COVID-19 pandemic.
Spending Per Commuter Rail and Transit Rider in the Five MTA Capital Plans 2020-2024
Transit riders take more than 6 million trips a day on MTA buses, subways, and commuter railroads to schools, jobs, doctors, and myriad cultural offerings throughout the city and region. The MTA relies on a massive, 24/7 transit network to move the region, including 1,038 rail-route miles, 5,840 buses, 9,077 rail cars, and 742 rail stations. Maintaining and modernizing this regional network that, in part, dates back to the 19th century while also balancing the capital intensive requirements of newer technologies, like battery electric buses, requires significant capital expense.
Since the 2000-2004 capital plan, the MTA has budgeted $194 billion in constant 2024 dollars to spend on capital projects. During this period, annual paid ridership across all MTA services grew 21% from 2.2 billion in 2000 to a high of 2.7 billion in 2014 before falling to 1.7 billion in 2024 because of the COVID-19 pandemic.
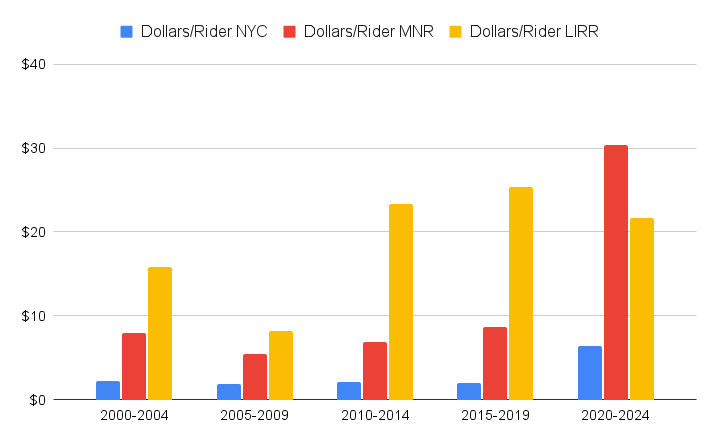
Between 2000 and 2024, New York City (NYC) accounted for 93% of the MTA’s ridership, yet received 71% of the capital funding since 2000. The Long Island Rail Road (LIRR) provided 3% of the MTA’s ridership, but netted 19% of the capital funding. Metro-North Railroad (MNR) also contributed 3% of the system’s ridership, but took in 10% of the capital funding. On a capital funding per rider per year basis, the data shows that the LIRR received $18.70 per rider, MNR received $10.20 per rider, and NYC received $2.57 per rider per year (see figure 1).
Figure 1. NYC, MNR and LIRR Spending Per Rider Per Year
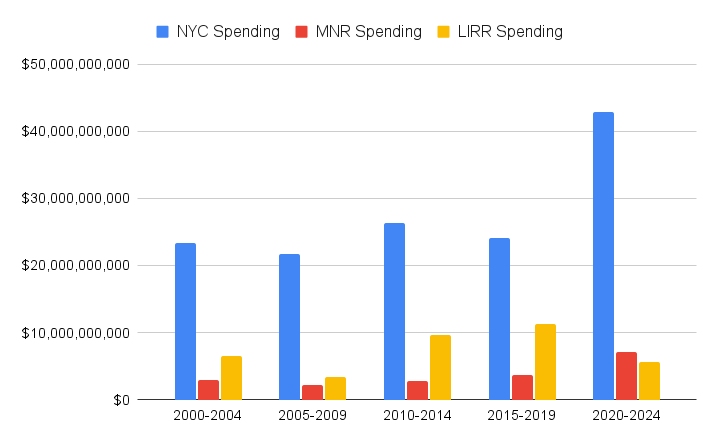
Historically, the MTA and its predecessor entities have struggled to maintain and expand the system simultaneously. Since the 2000-2004 capital plan, where we started our analysis, the MTA has attempted to tackle both. Unsurprisingly this has led to larger, more expensive capital plans over time (see figure 2).
Figure 2. Total NYC, MNR and LIRR Spending Per Rider Capital Program
Investment in network expansion has remained steady during this period, hovering around 20% of the overall plans. The 2000-2004 plan included funding for big ticket, seemingly generational expansion projects like East Side Access, Phase 1 of the Second Avenue Subway, and the 7 extension. These projects, in particular, remained in successive capital plans beyond 2000-2004. The 7 line extension fell out of the capital plan after 2005-2009, while Phase 1 of the Second Avenue Subway gave way to Phase 2 of the Second Avenue Subway in the 2015-2019 capital plan. East Side Access, in particular, has dominated multiple capital plans, including consuming 64% of the 2010-2014 network expansion budget. MNR has seen its fortunes rise as Penn Station Access has taken up a bigger proportion of the network expansion dollars in the 2020-2024 plan.
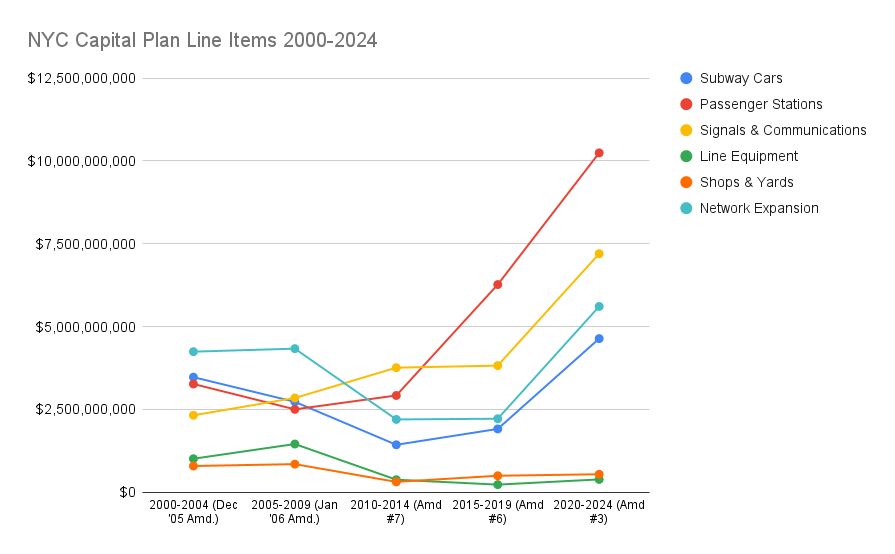
Beyond network expansion, items like rolling stock, stations, power, and signals routinely run into the hundreds of millions and billions of dollars for LIRR, MNR, and NYC. These investments vary from plan to plan so we can quickly see how shifting needs across plans drives variation over time. NYC ADA upgrades capture this dynamic perfectly. In the 2010-2014 plan, NYC allocated $336 million to these projects. Just two plans later, 2020-2024, that category swelled to $4 billion. This growth, however, has been accompanied by spending reductions in other categories over the same time period, such as Line Equipment and Shops and Yards (see figure 3).
Figure 3. NYC Capital Plan Line Items
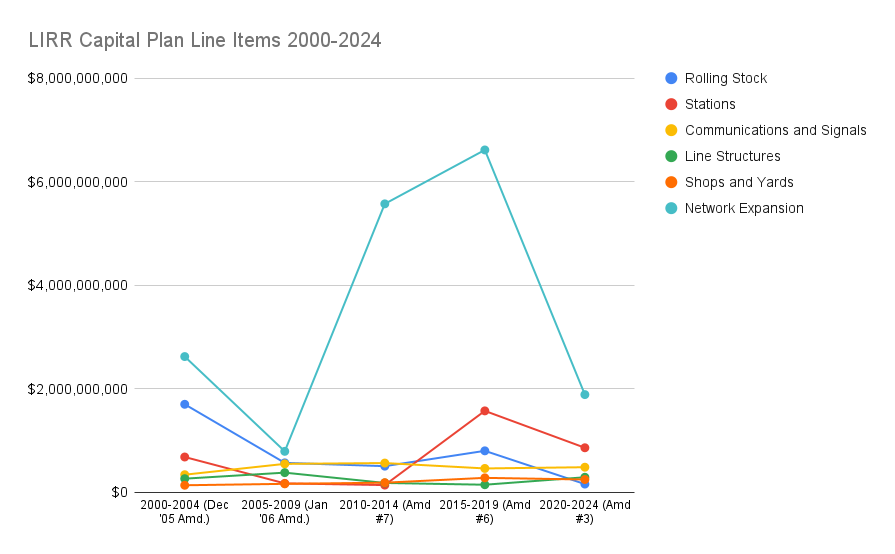
In the opposite direction, once new rolling stock is acquired the need to replace it in the following capital plans diminishes. In the 2000-2004 capital plan, LIRR budgeted $1.7 billion for rolling stock, namely to replace M1s with M7s. In the 2020-2024 plan, not surprisingly, that amount declined to $158.9 million. With less money needed for rolling stock, LIRR increased its spending on the Stations (see figure 4).
Figure 4. LIRR Capital Plan Line Items
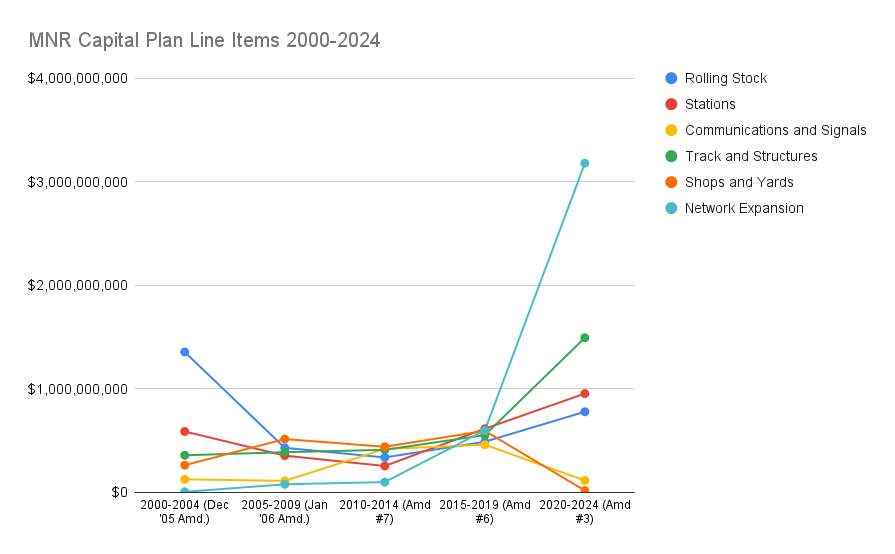
Similarly, in the 2020-2024 plan, MNR anticipated spending $899 million replacing the Park Avenue Viaduct. In the 2005-2009 plan, the entire Track and Structures category, of which the Park Avenue Viaduct is a line item, totalled $387 million. Just as we saw with the LIRR, MNR accounted for its need to expend more resources on the Park Avenue Viaduct by slashing expenditures on Shops and Yards relative to earlier capital plans (see figure 5).
Figure 5. MNR Capital Plan Line Items
The MTA Capital Plan is both how the MTA prioritizes projects critical to maintaining and expanding its network, a technocratic exercise, and ensures that the different operating agencies’ needs are addressed in a manner that keeps everyone happy, a political exercise. The variation in spending over time shows that each operating agency has seen its funding rise and fall in a predictable fashion: New York City received $21.7 billion, or 72% of the capital budget in the 2005-2009 plan, but saw its proportional slice of the pie decline to only 56%, or $24.1 billion, in the 2015-2019 plan. MNR saw its capital funding shrink as LIRR took a larger portion of capital funding to complete East Side Access. Since East Side Access’ spending has wound down, MNR has seen its needs receive greater capital funding as it readies for Penn Station Access.
Methods
To conduct this research we gathered MTA capital plan data from historical MTA capital plans and amendments to get the most up to date cost information. We separated costs by operating agency and assigned network expansion costs to the appropriate agency. In instances where joint costs could not be readily separated, such as Administrative Costs, we left them as standalone costs in our spreadsheet and did not assign them to a specific operating agency. For the Harold Interlocking, we distributed costs between LIRR and Metro-North proportionally based on proposed peak running schedules. We combined this cost data with paid ridership data between 2000 and 2024 provided by the MTA or found at data.ny.gov. Finally, in order to normalize costs from different time periods, we took the midpoint of each capital plan, so for the 2000-2004 plan, we selected 2002, and then applied an inflation adjustment based on the Historical Consumer Price Index for All Urban Consumers, in this case 1.74, to convert the 2002 prices to 2024 prices. All of our data can be accessed here.
See below or click here to view the analysis as a PDF.