The MTA Is Big Business In The Tri-State Region
MTA Paid $35 Billion to Area Companies Over Last Decade
July 2024
Explore the Fact Sheets
New York’s Metropolitan Transportation Authority (MTA) serves millions of transit riders every day, ensuring that they can get to work, school, and other hubs of activity, and enabling the NYC metropolitan region to be the economic engine of the entire tri-state area. But the MTA’s reach extends far beyond the metropolitan region, with the authority spending nearly $35 billion on payments to companies located throughout New York, New Jersey and Connecticut from 2014-2023.
Our comprehensive analysis of the amount spent by the MTA on vendors throughout New York, New Jersey, and Connecticut emphasizes the damaging effect of canceling congestion pricing which, as reported by the New York Times, puts 100,000 jobs at risk (see our June 2024 analysis). We hope that readers—including policy-makers, urban planners, and transit advocates—will find the district-specific fact sheets helpful in understanding the local implications of Governor Hochul’s decision to “indefinitely pause” congestion pricing.
Previously, Reinvent Albany published details of the MTA spending on companies in New York State (November 2023), New Jersey (June 2023) and across the United States (June 2020).
Key Findings
- 100,000 jobs are at risk in New York State alone due to Governor Hochul’s cancellation of congestion pricing. Congestion pricing is the single largest source of funding ($15 billion or 29%) for the MTA’s $51.5 billion 2020-2024 capital plan.
- The MTA spent $35 billion on outside vendors in New York, New Jersey, and Connecticut from 2014-2023.
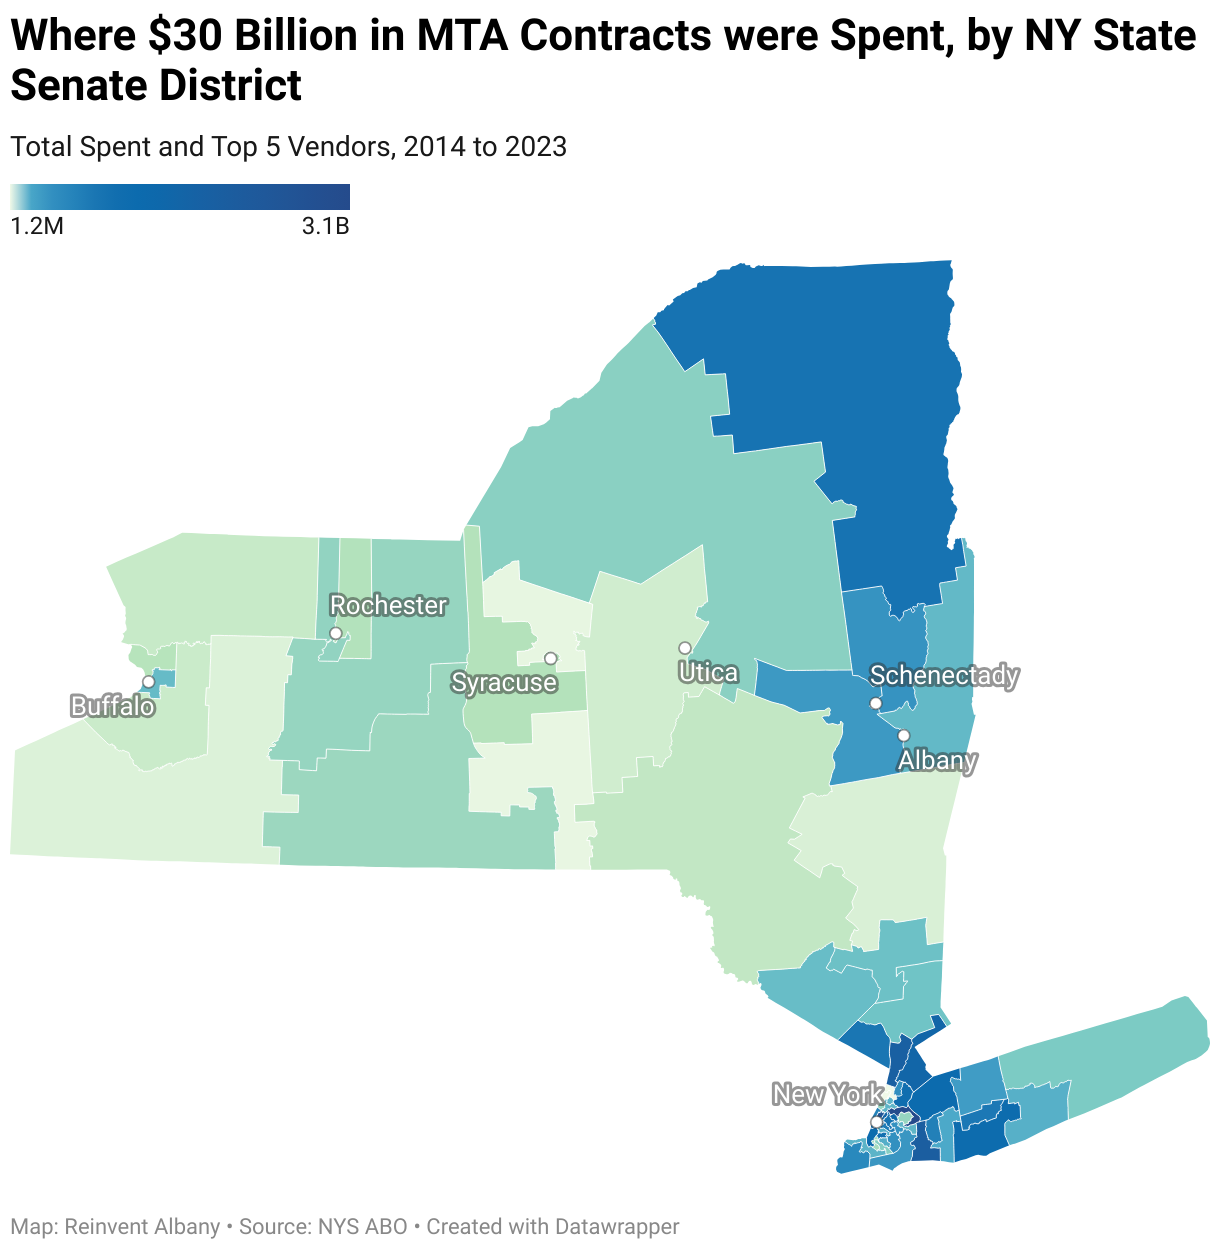
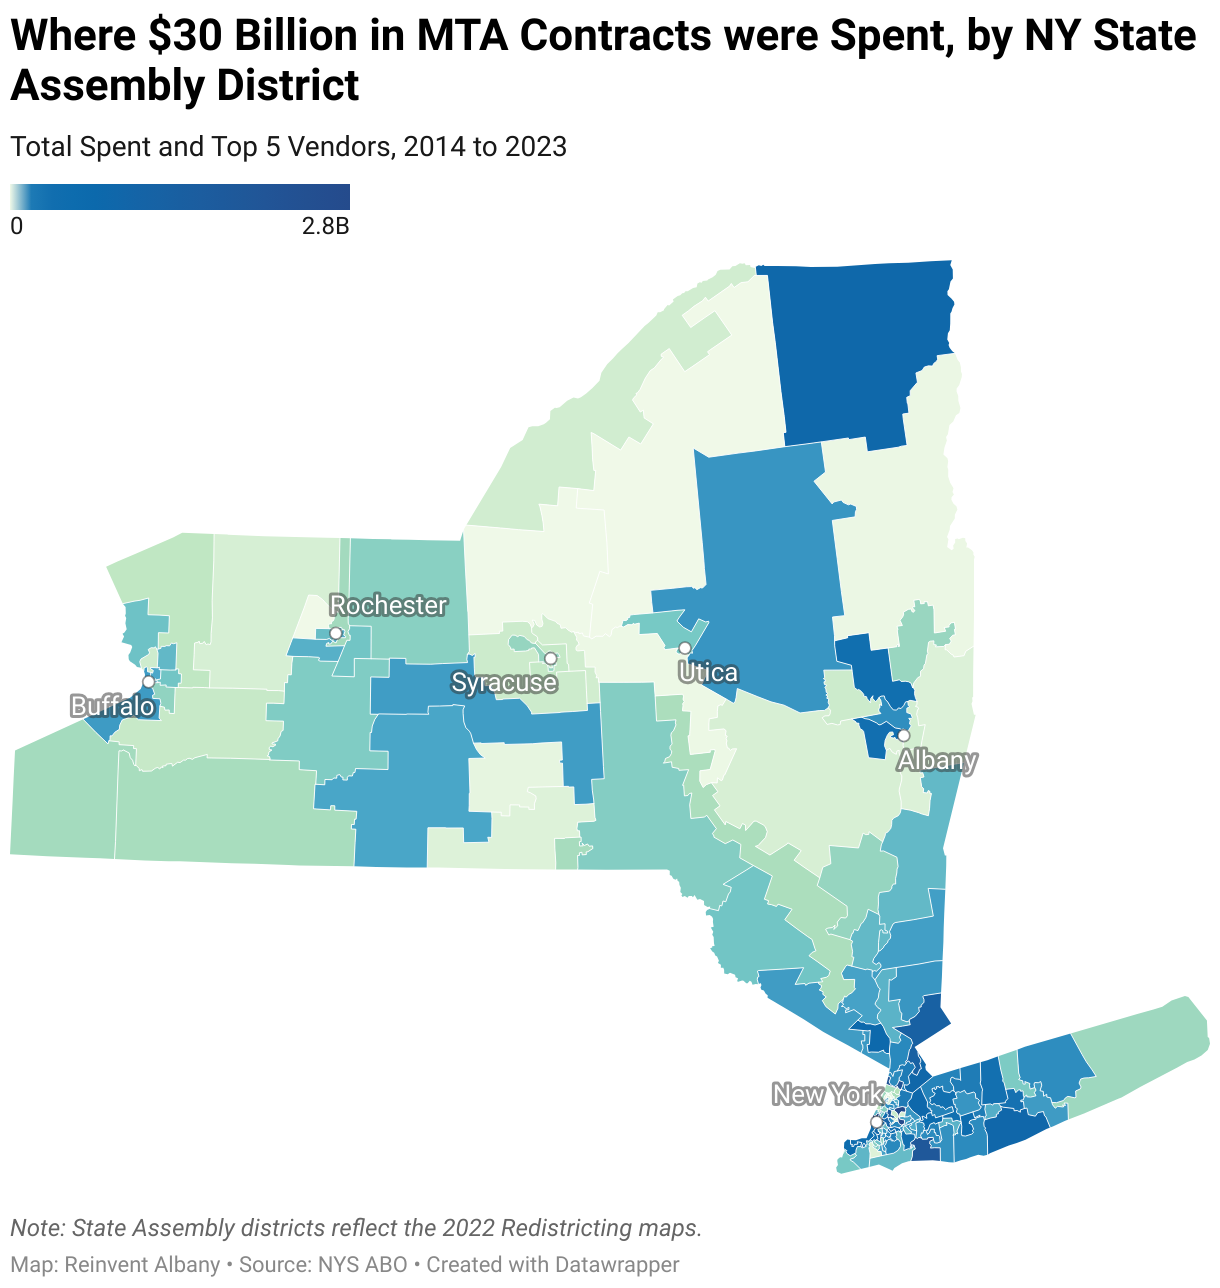
- Every congressional district in the states of New York, New Jersey and Connecticut has companies receiving MTA payments, in addition to every single NYS senate district; 148 of the 150 state assembly districts (99%) are recipients of MTA spending.
- Congestion pricing remains essential to improve air quality, reduce traffic congestion, save time worth billions to people and businesses, fund crucial transit projects, and create thousands of good jobs with MTA vendors throughout the region.
Visualizing MTA Spending Across New York Districts
The 2020-2024 Capital Plan
A $51.5 Billion Investment Fueled by Congestion Pricing
The MTA’s $51.5 billion Capital Plan for 2020-2024 will revamp the transit authority’s infrastructure. ($51.5 billion represents the NYCT, LIRR, MNR and MTA Buses component of the plan; an additional $3.3 billion is self-financed by Bridges & Tunnels.) Funded in large part by congestion pricing—making up 29% of its funding, the single largest source—this ambitious Capital Plan embodies New York’s commitment to improving the subways, buses, and commuter railroads, as well as the resilience of our infrastructure, and sustained economic growth.
Congestion pricing’s benefits go well beyond traffic reduction; the program also bears broader economic and environmental implications. The revenue generated supports MTA capital projects, which feed back into businesses across the region.
Benefits of Congestion Pricing
Labor: Reinvent Albany’s recent analysis shows that $3.2 billion – 21% of the total $15 billion raised by congestion pricing – would fund in-house capital work done by MTA workers, largely represented by TWU Local 100. In total, 7,300 workers are reimbursed by the MTA’s capital plans each year, and a portion of these jobs are at risk.
Community Revitalization: Less traffic has the potential to lead to pedestrian-friendly zones, enhancing local businesses.
Equitable Transit Access: Funds are directly invested into transit projects across the metropolitan region, aiding marginalized communities, and promoting equitable transit access.
Environmental Benefits: Cleaner air and safer streets contribute to New York City’s appeal.
Methodology
Vendor data obtained from the Open NY Data Portal (see here and here) was cleansed and integrated by deduplicating names and addresses, using alphabetical and zip code sorting while rectifying spelling errors, business aliases, and changes due to mergers or acquisitions. Address information was confined to the years 2022 and 2023. Post-deduplication, these addresses were integrated into the 2014-2021 records based on matching vendor names and zip codes, under the premise that vendors operate a single location per zip code.
For vendors without direct matches in NY, particularly those with cumulative transactions exceeding $1 million, encompassing 300 vendors and 354 vendor-zip code combinations, a manual search was conducted. This process involved verifying addresses through Google and commercial datasets, such as Dun & Bradstreet and Yellow Pages, successfully pinpointing addresses for 329 pairs. For vendors without direct matches in NJ and CT, vendors with the largest number of transactions had addresses similarly manually searched and verified.
Subsequently, these identified addresses underwent precise geocoding via the ArcGIS Geocoding Service. Transactions without detailed addresses were geocoded at the zip code centroid.
District maps are based on those that will take effect after the 2024 elections; current incumbents are listed.
See also our datasheet of the top 10 vendors by NYS, NJ, and CT congressional districts, and NYS Assembly and Senate districts for incumbents currently in office as of June 2024.