The MTA Is Big Business for New York
MTA Spent $26 Billion on Vendors Located Throughout NYS
November 2023
Explore the Fact Sheets
Congressional Fact Sheets
District 1
District 2
District 3
District 4
District 5
District 6
District 7
District 8
District 9
District 10
District 11
District 12
District 13
District 14
District 15
District 16
District 17
District 18
District 19
District 20
District 21
District 22
District 23
District 24
District 25
District 26
State Senate Fact Sheets
Senate District 1
Senate District 2
Senate District 3
Senate District 4
Senate District 5
Senate District 6
Senate District 7
Senate District 8
Senate District 9
Senate District 10
Senate District 11
Senate District 12
Senate District 13
Senate District 14
Senate District 15
Senate District 16
Senate District 17
Senate District 18
Senate District 19
Senate District 20
Senate District 21
Senate District 22
Senate District 23
Senate District 24
Senate District 25
Senate District 26
Senate District 27
Senate District 28
Senate District 29
Senate District 30
Senate District 31
Senate District 32
Senate District 33
Senate District 34
Senate District 35
Senate District 36
Senate District 37
Senate District 38
Senate District 39
Senate District 40
Senate District 41
Senate District 42
Senate District 43
Senate District 44
Senate District 45
Senate District 46
Senate District 47
Senate District 48
Senate District 49
Senate District 50
Senate District 51
Senate District 52
Senate District 53
Senate District 54
Senate District 55
Senate District 56
Senate District 57
Senate District 58
Senate District 59
Senate District 60
Senate District 61
Senate District 62
Senate District 63
Assembly Fact Sheets
Assembly District 1
Assembly District 2
Assembly District 3
Assembly District 4
Assembly District 5
Assembly District 6
Assembly District 7
Assembly District 8
Assembly District 9
Assembly District 10
Assembly District 11
Assembly District 12
Assembly District 13
Assembly District 14
Assembly District 15
Assembly District 16
Assembly District 17
Assembly District 18
Assembly District 19
Assembly District 20
Assembly District 21
Assembly District 22
Assembly District 23
Assembly District 24
Assembly District 25
Assembly District 26
Assembly District 27
Assembly District 28
Assembly District 29
Assembly District 30
Assembly District 31
Assembly District 32
Assembly District 33
Assembly District 34
Assembly District 35
Assembly District 36
Assembly District 37
Assembly District 38
Assembly District 39
Assembly District 40
Assembly District 41
Assembly District 42
Assembly District 43
Assembly District 44
Assembly District 45
Assembly District 46
Assembly District 47
Assembly District 48
Assembly District 49
Assembly District 50
Assembly District 51
Assembly District 52
Assembly District 53
Assembly District 54
Assembly District 55
Assembly District 56
Assembly District 57
Assembly District 58
Assembly District 59
Assembly District 60
Assembly District 61
Assembly District 62
Assembly District 63
Assembly District 64
Assembly District 65
Assembly District 66
Assembly District 67
Assembly District 68
Assembly District 69
Assembly District 70
Assembly District 71
Assembly District 72
Assembly District 73
Assembly District 74
Assembly District 75
Assembly District 76
Assembly District 77
Assembly District 78
Assembly District 79
Assembly District 80
Assembly District 81
Assembly District 82
Assembly District 83
Assembly District 84
Assembly District 85
Assembly District 86
Assembly District 87
Assembly District 88
Assembly District 89
Assembly District 90
Assembly District 91
Assembly District 92
Assembly District 93
Assembly District 94
Assembly District 95
Assembly District 96
Assembly District 97
Assembly District 98
Assembly District 99
Assembly District 100
Assembly District 101
Assembly District 102
Assembly District 103
Assembly District 104
Assembly District 105
Assembly District 106
Assembly District 107
Assembly District 108
Assembly District 109
Assembly District 110
Assembly District 111
Assembly District 112
Assembly District 113
Assembly District 114
Assembly District 115
Assembly District 116
Assembly District 118
Assembly District 119
Assembly District 121
Assembly District 122
Assembly District 123
Assembly District 124
Assembly District 125
Assembly District 126
Assembly District 127
Assembly District 128
Assembly District 129
Assembly District 130
Assembly District 131
Assembly District 132
Assembly District 133
Assembly District 135
Assembly District 136
Assembly District 137
Assembly District 138
Assembly District 139
Assembly District 140
Assembly District 141
Assembly District 142
Assembly District 143
Assembly District 144
Assembly District 145
Assembly District 146
Assembly District 147
Assembly District 148
Assembly District 149
Assembly District 150
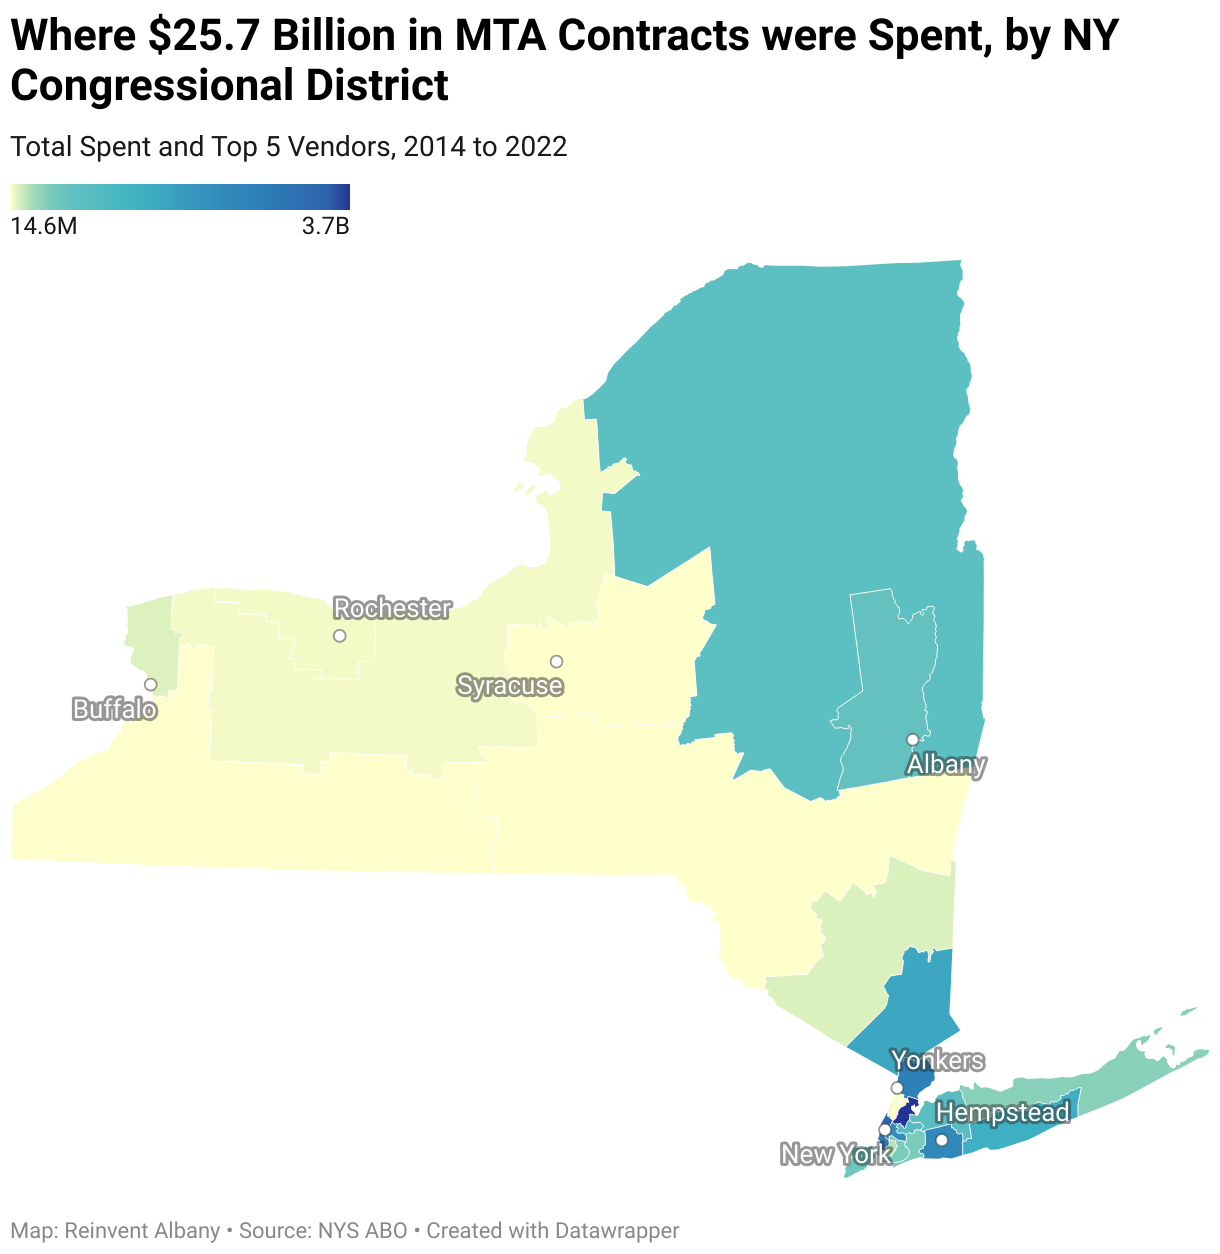
New York’s Metropolitan Transportation Authority (MTA) serves millions of transit riders every day, ensuring that they can get to work, school, and other hubs of activity, and enabling the NYC metropolitan region to be the state’s economic engine. But the MTA’s reach extends far beyond the metropolitan region, with the authority spending nearly $26 billion on payments to companies located throughout the state from 2014-2022. Previously, Reinvent Albany published details of the MTA spending on companies in New Jersey (June 2023) and across the United States (June 2020).
Our comprehensive analysis of the amount spent by the MTA on vendors statewide emphasizes the future role of congestion pricing as a contributor to the state’s economy beyond New York City. We hope that readers—including policy-makers, urban planners, and transit advocates—will find this information helpful in understanding the far-reaching implications of the MTA’s spending in specific NYS assembly, senate, and congressional districts.
Key Findings
- The MTA spent $26 billion on vendors statewide from 2014-2022.
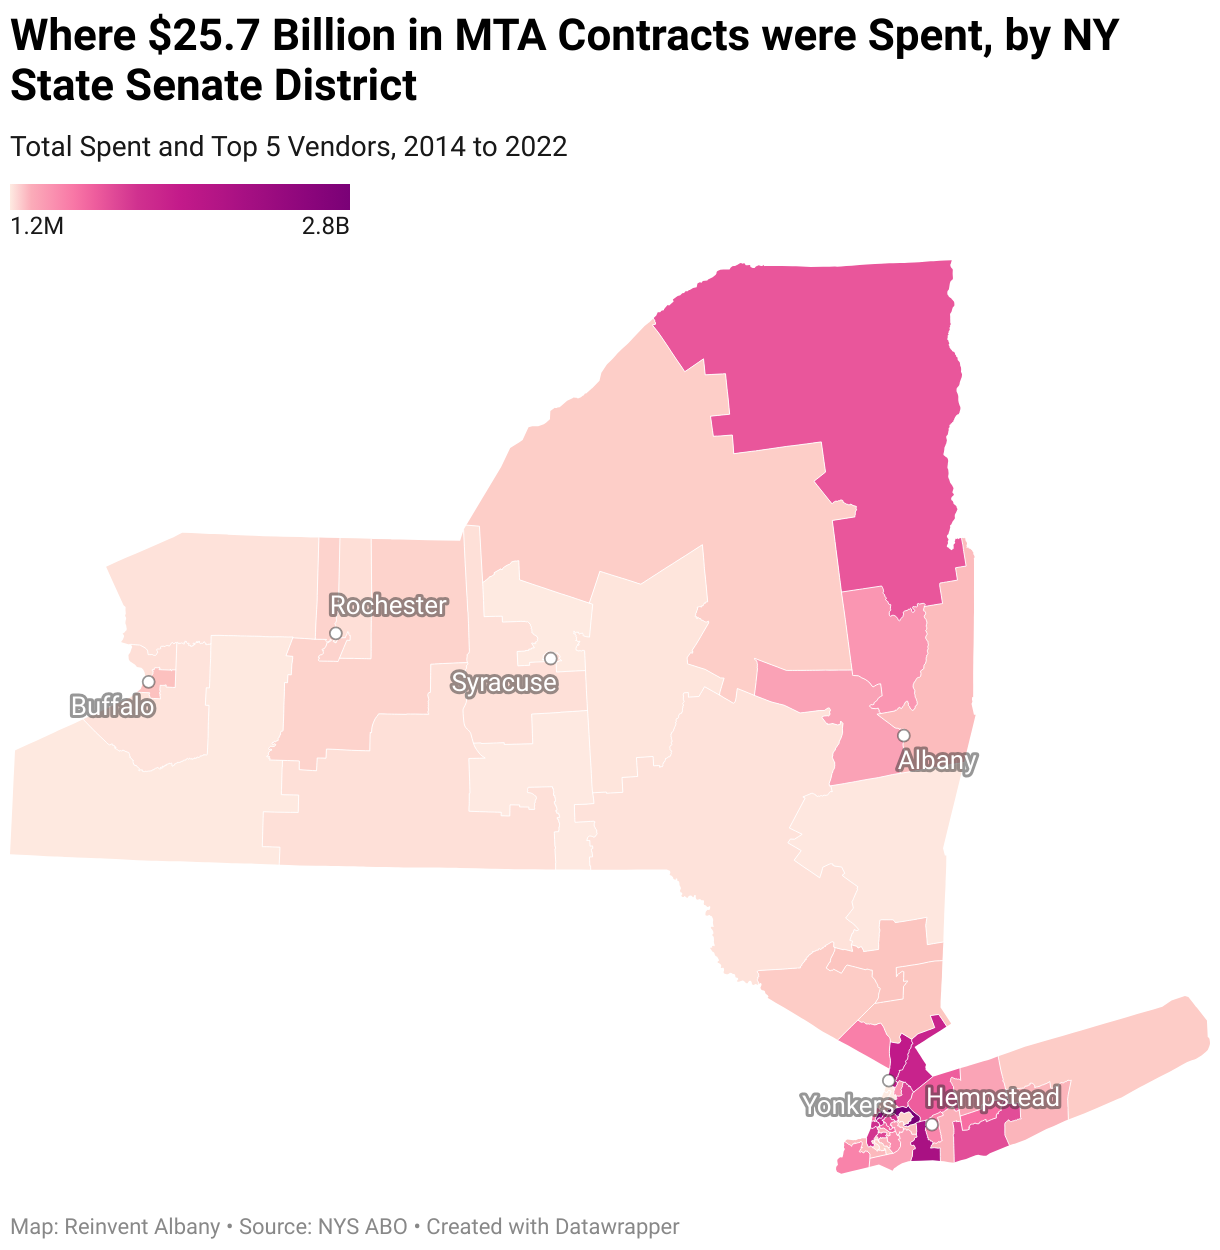
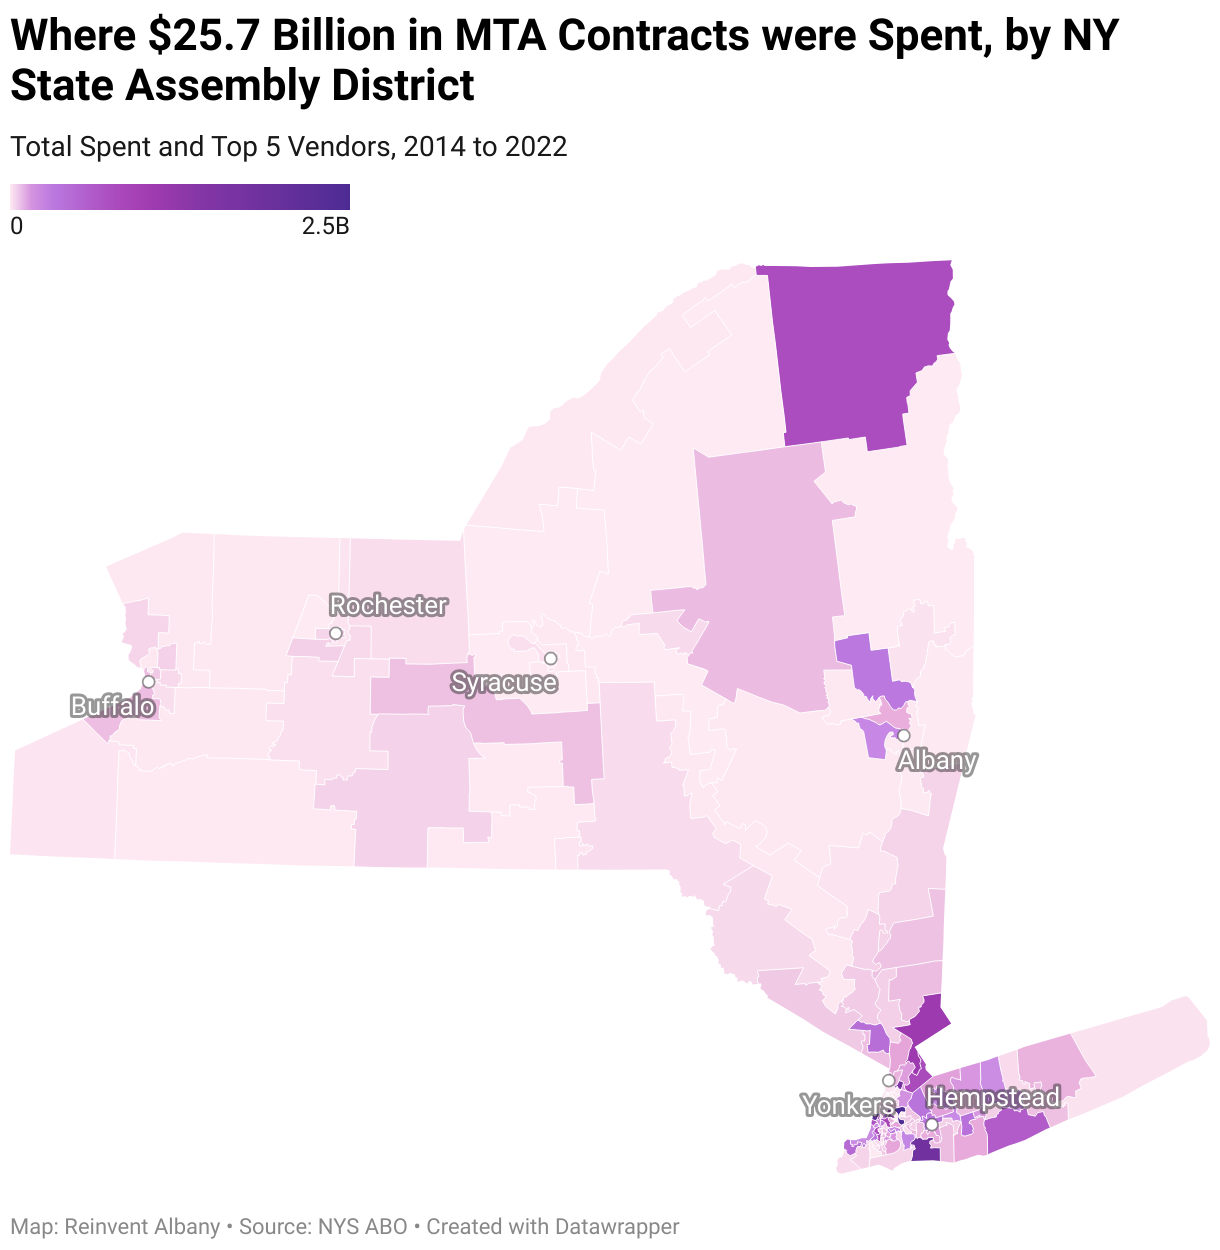
- Every single senate and congressional district within New York State has companies receiving MTA payments; 147 of the 150 state assembly districts (98%) are recipients of MTA spending.
- MTA’s $55 Billion 2020-2024 Capital Plan, partly financed by congestion pricing, is a massive investment in the MTA’s buses, subways, and commuter railroads that will benefit companies throughout the state who do business with the MTA.
- Congestion pricing will improve air quality, reduce traffic congestion, save time worth billions to people and businesses, fund crucial transit projects, and create thousands of good jobs with MTA vendors throughout the state.
Visualizing MTA Spending Across New York Districts
The 2020-2024 Capital Plan
A $55 Billion Investment Fueled by Congestion Pricing
The MTA’s $55 billion Capital Plan for 2020-2024 will revamp the transit authority’s infrastructure. Financed in part by congestion pricing—making up 27% of its funding, the single largest source—this ambitious Capital Plan embodies New York’s commitment to improving the subways, buses, and commuter railroads, as well as the resilience of our infrastructure, and sustained economic growth.
Congestion pricing’s benefits go well beyond traffic reduction; the program also bears broader economic and environmental implications. The revenue generated supports MTA capital projects, which feed back into businesses across the state.
Benefits of Congestion Pricing
Labor: Reinvent Albany’s recent analysis shows that $3.2 billion – 21% of the total $15 billion raised by congestion pricing – will fund in-house capital work done by MTA workers, largely represented by TWU Local 100.
Community Revitalization: Less traffic has the potential to lead to pedestrian-friendly zones, enhancing local businesses.
Equitable Transit Access: Funds are directly invested into transit projects across the metropolitan region, aiding marginalized communities, and promoting equitable transit access.
Environmental Benefits: Cleaner air and safer streets contribute to New York City’s appeal.
Understanding the influence of MTA spending is indispensable for stakeholders, who range from policymakers and urban planners to seasoned transit advocates. The agency’s capital projects, funded by congestion pricing, will result in hiring of numerous companies throughout New York State. The MTA vendor data in the charts below underscores how the MTA’s fiscal decisions impact communities and industries far beyond New York City’s borders.
Examining MTA Spending in Key Investment Districts
The pie charts presented below show the total value of payments made by the MTA to vendors in the congressional, senate, and assembly districts with the most payments from 2014-2022. In each district, the charts break down the percentage of spending attributed to the top five vendors, with a dedicated segment representing the collective contribution of all other vendors. The charts aim to help stakeholders better understand which companies are the biggest players at the local level.
Methodology
Vendor data obtained from the Open NY Data Portal (see here and here) was cleansed and integrated by deduplicating names and addresses, using alphabetical and zip code sorting while rectifying spelling errors, business aliases, and changes due to mergers or acquisitions. Address information was confined to the year 2022. Post-deduplication, these addresses were integrated into the 2014-2021 records based on matching vendor names and zip codes, under the premise that vendors operate a single location per zip code.
For vendors without direct matches, particularly those with cumulative transactions exceeding $1 million, encompassing 300 vendors and 354 vendor-zip code combinations, a manual search was conducted. This process involved verifying addresses through Google and commercial datasets, such as Dun & Bradstreet and Yellow Pages, successfully pinpointing addresses for 329 pairs.
Subsequently, these identified addresses underwent precise geocoding via the ArcGIS Geocoding Service for 32,172 transactions (85.8%), which represent $25.3 billion (98.4% of the transaction value). Remaining transactions without detailed addresses were geocoded at the zip code centroid, covering 5,312 transactions (14.2%), equivalent to $415 million (1.6% of the transaction value).
See also our datasheet of the top 5 vendors by assembly, senate, and congressional district.