Comparison of Cost Estimates for the Public Financing of Elections
Cost Estimates of Public Financing of Elections
Two significantly different estimates of the cost of a state public financing program were offered to the New York State Senate Elections Committee at its March 20th hearing. This memorandum explains the two cost estimates and why the higher estimate is less reliable.
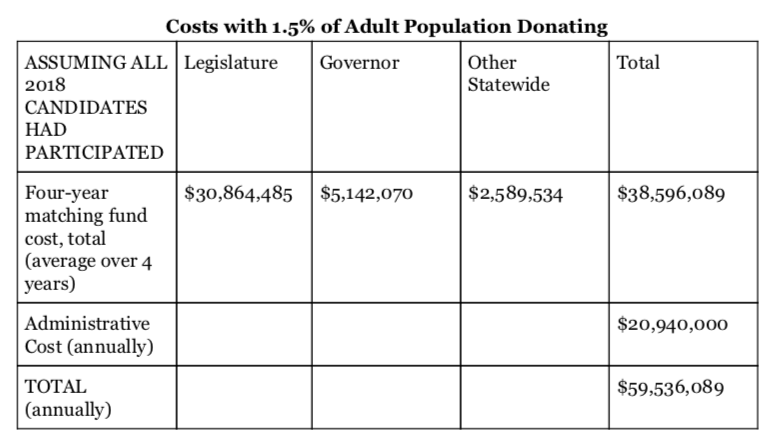
The lower estimate comes from Michael Malbin, a SUNY Albany political science professor and director of the nonpartisan Campaign Finance Institute (CFI). CFI’s most costly estimate of a public financing program in New York State is $59.5 million annually, which includes an average annual cost for the disbursement of public funds of $38.6 million and $20.9 million in administrative costs.1 An adapted chart from Michael Malbin’s (CFI) analysis is below:
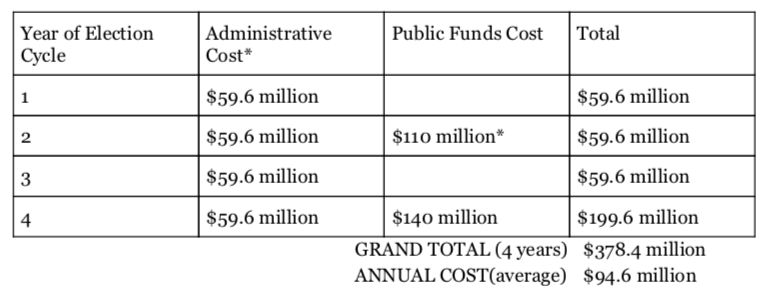
In their testimony to the State Senate Elections Committee on March 20, 2019, the New York State Board of Elections (SBOE) submitted a far higher estimate of the cost of a public matching system in New York State based on Governor Cuomo’s FY2019-2020 Executive Budget proposal. The SBOE estimated $59.6 million annually for administrative costs and $140 million for disbursing public matching funds in statewide election years, and $110 million for disbursing public funds in midterm legislative election years. For a full election cycle, the cost according to the SBOE would be as follows:
Does not include an estimated $3.25 million in technology/software upgrades.
* The $110 million legislative midterm estimate in the SBOE’s testimony is easily misinterpreted as a separate expenditure when in fact it should be a subset of the $140 million. It is therefore not counted as part of the Total in Election Cycle Year 2.
Administrative Costs: CFI vs SBOE
The SBOE estimates their administrative costs to administer a public financing program to be $59.6 million annually while the CFI’s estimate is 1⁄3 that at $20.94 million annually.
The SBOE reaches its estimate by applying a 3.67 multiplier to the FY2019 budget for the New York City Campaign Finance Board (NYC CFB) (3.67 x $16.28 million). The 3.67 multiplier is derived from NYS having 367 percent more offices than NYC, 217 NYS offices to 59 NYC offices.
There are numerous shortcomings to the SBOE’s approach.
First, the NYC CFB does not dedicate its entire budget to campaign finance administration. A 2013 memo issued by the NYC CFB to then-Senator Jeffrey D. Klein regarding the costs of a public matching system indicated 48 percent of its FY2014 budget was spent issuing its video and print Voter Guide, which is not in Governor Cuomo’s Executive Budget proposal. Fifty-two percent of the $16.28 million FY2019 CFB budget is $8.46 million. Assuming the same proportion of personal expenditures in FY2019 as in FY2013, the CFB will spend $5.91 million on personal services in FY2019. But only 70 percent of $5.91 million, or $4.13 million, is for staff – candidate liaisons, auditors, and compliance – that would need to increase in size to provide more campaign finance administration for additional state offices (other offices like Press and Information Technology the CFB states are constant in size regardless of the number of offices or candidates in the public matching program).
Furthermore, the SBOE multiplier compares the number of NYS elected offices to NYC elected offices to calculate the multiplier while the more relevant estimate is to compare the number of candidates, which the CFI uses, and assumes a generous increase over the number of candidates that ran in 2018. Using the number of candidates rather than number of offices lowers the multiplier to 3.51 rather than 3.67. Using the CFI 3.51 multiplier for personal expenses results in a personal budget of $14.49 million to account for the additional offices in NYS (CFI used a 3.51 multiplier and the NYS GOP a 4.35 multiplier according to the 2013 CFB memo).
Non-personal service expenditures for the NYC CFB in FY2019 are $4.9 million, according to the SBOE. However, the NYC CFB 2013 memo states 30 percent, or $1.47 million, of its non-personal costs are rent. Rent is substantially cheaper in Albany than NYC. The NYC CFB estimates rent in Albany at 1/3 the cost of New York City, or $485,000. The other non-personal costs would double for the SBOE according to the NYC CFB to accommodate for the larger public financing program, meaning non-rent costs would be $6.86 million. Including $485,000 in rent, the total non-personal costs for NYS would be $7.345 million.
Adding the $7.345 million in non-personal costs to the $14.49 million in personal costs, the total costs for administering the program would be $21.835 million annually. This is very close to the $20.984 million the CFI took directly from the NYC CFB memo in 2013. It also does not include savings from enforcement actions in penalties.
The SBOE includes $3.25 million in additional technology development, maintenance, and service, and hardware and software costs in its testimony. The CFB memo only says “computer equipment…would increase to scale.”
Public Matching Costs: CFI vs SBOE
In assessing the costs of public matching funds, the SBOE on page 6 of its testimony cites a CFI report from December 2018 that estimates the cost of disbursing public matching funds to candidates at $140.5 million over 4 years, or $35.125 million a year, which is about the same as the $38 million estimated by the CFI in their more recent February 2019 report.
However, the SBOE in the last sentence on page 6 of its testimony states, “In the midterm legislative election $110 million to be paid in public funds.” This appears to bea subset of the $140.5 million over 4 years from the December 2018 CFI projection rather than being an amount in addition to the $140.5 million over 4 years. Interpreted this way, the SBOE public funds disbursement is actually $35.125 million over 4 years based on a dated analysis by the CFI, which has now been updated to reflect the more recent $38 million the CFI estimates. So these estimates are largely the same, as the SBOE is relying on the CFI’s analysis.


