How the MTA Can Share More Ridership and Financial Data During COVID-19
San Francisco’s BART System Shows How MTA Can Share More Ridership and Financial Data During COVID-19
Transparency through sharing of data is one of the best ways the government can help inform the public in difficult times. Data on the COVID-19 crisis’s impact on transit will be essential as the Metropolitan Transportation Authority (MTA) advocates for additional financial assistance, as ridership continues to be low and the MTA sees drops in dedicated taxes in the coming months. After a reported 87% decline in ridership, the MTA has received $3.8B in federal stimulus funds, but this will not be nearly enough to help it maintain solvency. The MTA has been slow to provide data on ridership, finances and worker availability, and timely sharing of this data will help improve the case for future federal funds.
The MTA can improve its transparency by providing open data showing how the authority has been affected by the crisis. Effective MTA COVID-19 data sharing should:
- Include the following data:
- Daily and weekly ridership declines compared with the previous year
- Impact on revenues from fares, tolls, dedicated taxes such as property, payroll and sales taxes, state financial assistance, and other revenue sources
- Daily and weekly data on worker availability
- Current and projected costs to MTA for COVID-19 related cleaning and emergency response, including overtime for emergency response and lack of workers available due to COVID
- Make data is easily accessible on the MTA’s COVID-19 landing page, including visualizations and the ability for download in an open data format.
- Update the data daily on the MTA’s website and state’s open data portal
- Include fact sheets summarizing data and detailing plans to address funding shortfalls
Bay Area Rapid Transit (BART) is a potential model for transit agencies to look toward for how to keep the public informed during a crisis. BART posts daily updates on ridership and produced a fact sheet on how COVID-19 has affected ridership and finances throughout the pandemic. Washington Metropolitan Area Transit Authority (WMATA) has also provided thorough ridership data since the outbreak began.
BART’s website includes the following, all of which the MTA can and should adopt:
Ridership declines
- Daily ridership numbers compared with the previous year (see below)
- Forecast on how long the situation could continue

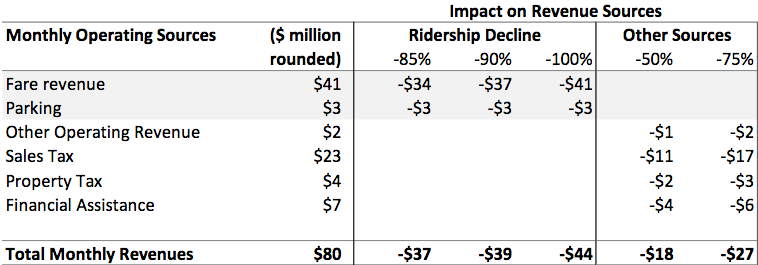
Revenue impacts
The section on revenue contains bullet points with explanations about BART’s various sources of income, as well as charts explaining the outbreak’s impact. These cover:
- Fare revenue
- Parking revenues
- Property tax revenue
- Sales tax revenue
- State financial assistance
- Other operating revenue (advertising and interest)
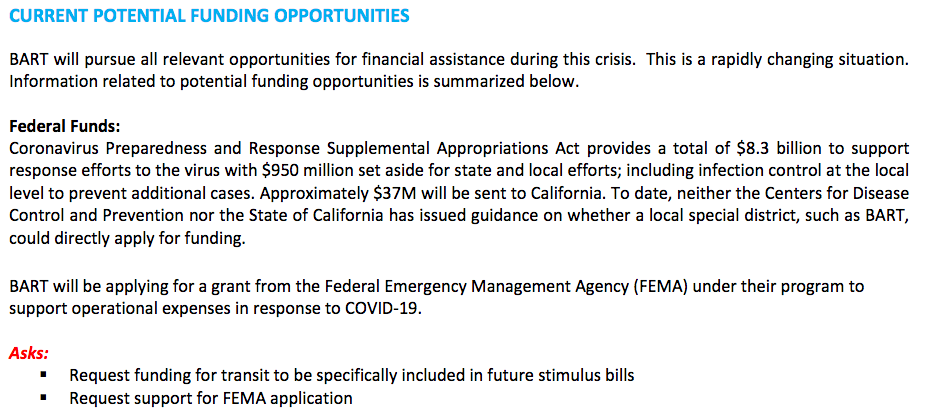
Potential funding opportunities
BART’s fact sheets conclude with a detailed explanation of how the agency is working to solve the crisis and what can be done in the future. This includes:
- How federal, state and local governments have assisted BART to date
- Grants and legislation that could provide additional funding
- BART’s “Asks” of federal, state and local governments
Better data sharing From MTA
Eleven groups have asked the MTA to share more information about its ridership and finances in an open data format. Advocates and our elected representatives will best be able to support the MTA’s funding requests if it provides additional data, including financial projections showing multiple possibilities, including best, medium and worst-case scenarios. The groups asked for information to be released in open data format, and through a dashboard, if possible, to allow the public to visualize the following information:
- Daily and weekly ridership numbers across all MTA transit systems, including paratransit, noting decline from past year figures
- Daily and weekly driver numbers across all MTA bridges and tunnels, noting decline from past year figures
- Current and projected revenue from ridership dropoff, as well as projected losses from the farebox across all MTA systems
- Current and projected losses from toll revenue across MTA bridges and tunnels
- Current and projected losses to MTA dedicated taxes
- Current and projected costs to MTA for COVID-19 related cleaning and other emergency response initiatives, including overtime for emergency response and due to lack of worker availability
Together, this data will provide a complete picture of the MTA’s finances.
Additionally, daily and weekly data regarding worker availability should be released as open data, so the public has a better understanding of worker shortages and the operating challenges of the MTA as the COVID-19 pandemic affects transit workers.